
Written by Outrank. Published by Mallary Labs LLC.
Published .
Social Media Analytics and Reporting: A Practical Guide
With 5.66 billion active social media user identities worldwide in October 2025, equal to 68.7% of the global population, social activity is too large to judge from one platform or a handful of posts, according to DataReportal's Digital 2026 Global Overview. Good social media analytics and reporting doesn't collect more charts. It turns messy platform numbers into a small report you can act on, with its limits stated plainly.
Table of Contents
- Why Social Media Reporting Is Harder Than It Looks
- Key Social Media Metrics and What Each One Tells You
- Why Platform Numbers Do Not Compare Directly
- How to Set Goals and a Reporting Cadence
- Report Templates and Dashboard Layouts
- Automating and Centralizing Analytics Across Platforms
- Measure Social Results When Person Level Data Is Missing
- Measuring Business Impact When Attribution Is Incomplete
Why Social Media Reporting Is Harder Than It Looks
In the Brandwatch Marketer of 2025 report, based on a survey of 1,378 marketers, 40% of marketers surveyed globally said measuring social media ROI was difficult in 2025. That difficulty rarely comes from a shortage of numbers. Platforms export plenty of data.
The problem is definition and timing. Say you open a dashboard on Monday morning. Reach is up, views are down, and engagement looks flat. Without knowing how each platform counted those values, or when each figure last refreshed, you're staring at a car instrument panel with no labels. The needles move, but you don't know whether you're looking at speed, fuel, or temperature.
Analytics Is Not Reporting
Readers often blur two different jobs. Analytics is finding out what happened and why. Reporting is packaging that finding so a named person can make a decision by a named date.
A report that does neither is a collection of charts, however polished it looks. Before you build yours, settle three things.
- Metrics: Which few numbers change a decision?
- Comparability: How will you make platform numbers honest and automated?
- Impact: How will you show business value without pretending attribution is complete?
Write down the one decision your next report should support. If you can't write it in one sentence, the report isn't ready to design.
Key Social Media Metrics and What Each One Tells You
| Metric | What it tells you | Basis or formula | Decision it informs |
|---|---|---|---|
| Reach | Unique accounts that saw a post | Count of unique accounts, not displays | Audience size of a campaign |
| Impressions | Total times content was displayed | Total displays, repeats included | Visibility and frequency |
| Views | Video plays counted by the platform | Platform-defined play threshold | Video performance, compared only within one platform |
| Engagement rate | Share of the audience that interacted | Engagements divided by reach or impressions, state which | Content quality comparison |
| Follower growth | Net change in audience | Followers at end minus followers at start | Audience building |
| Click-through rate | Share of viewers who clicked a link | Clicks divided by impressions | Link and call-to-action effectiveness |
| Comments and replies | Depth of conversation | Count, plus a sample read for sentiment | Community health |
| Shares and saves | Advocacy and intent to return | Count per post | Which content is worth repeating |
| Conversions | Actions completed after a post | Tracked with UTM parameters or CRM records | Revenue or lead impact |
The Two Distinctions Readers Miss Most
Reach counts people. Impressions count displays. If one account sees a post three times, that's one reach and three impressions. If your impressions climb while reach stays flat, you're showing content more often to the same audience, not finding a new one. If you want a clear plain-language refresher on that display count, Boocoo's guide to marketing impressions is a useful companion.
Engagement rate has no universal formula. Dividing engagements by reach gives you a different number than dividing by impressions, and both are defensible. What's not defensible is switching between months without noting it. Write the denominator in the report itself.
A rising engagement rate with flat reach often means a small, loyal audience is responding more, not that your audience is growing.
Pick three to five metrics per goal, not all nine. Test each one with a simple question. Which decision does it change? If a metric can't tell you which format to repeat, which channel to cut, or which call to action to rewrite, leave it out. For a deeper look at tying metrics to goals, see our guide to content performance metrics.
Why Platform Numbers Do Not Compare Directly
Post the same video to two platforms and you'll get two view counts. That doesn't mean one platform performed better. Each platform decides when a play counts as a view, so a side by side chart can reward the looser definition, not the stronger video.
A peer-reviewed analysis of altmetric aggregators found substantial differences caused by four layers, collection method, aggregation and reporting logic, update frequency, and technical implementation. Even a simple total changes depending on whether a system counts posts, likes, shares, and comments separately or rolls them into one interaction number. That's why provenance matters more than polish.
What to Store With Every Value
Keep these fields attached to each metric, not in a separate document nobody opens.
- Platform and endpoint: Where the value came from.
- Retrieval timestamp: When you pulled it, since counts get revised.
- Scope: Which account and which posts are included.
- Paid or organic status: Mixed totals hide what's working.
- Denominator and formula version: Essential for any rate.
Separate raw counters such as likes, comments, shares, views, reach, and impressions from derived measures such as engagement rate. Raw counters come from the platform. Derived measures come from your formula, so store that formula alongside the result.
Say a platform changes how it counts video views and your historical line drops overnight. Without stored provenance, you'll blame the campaign and maybe cancel a format that was working. With it, you can see the definition changed and annotate the break.
Store null or unavailable when a platform doesn't return a field, never zero. A zero claims nothing happened. A null admits you don't know, and that's more trustworthy. Set retention limits too, and prefer aggregated cohorts over person level profiles when you aggregate.
Before you merge two platforms into one chart, try this test. Can you state each metric's definition in one sentence? If not, keep them in separate panels.
How to Set Goals and a Reporting Cadence
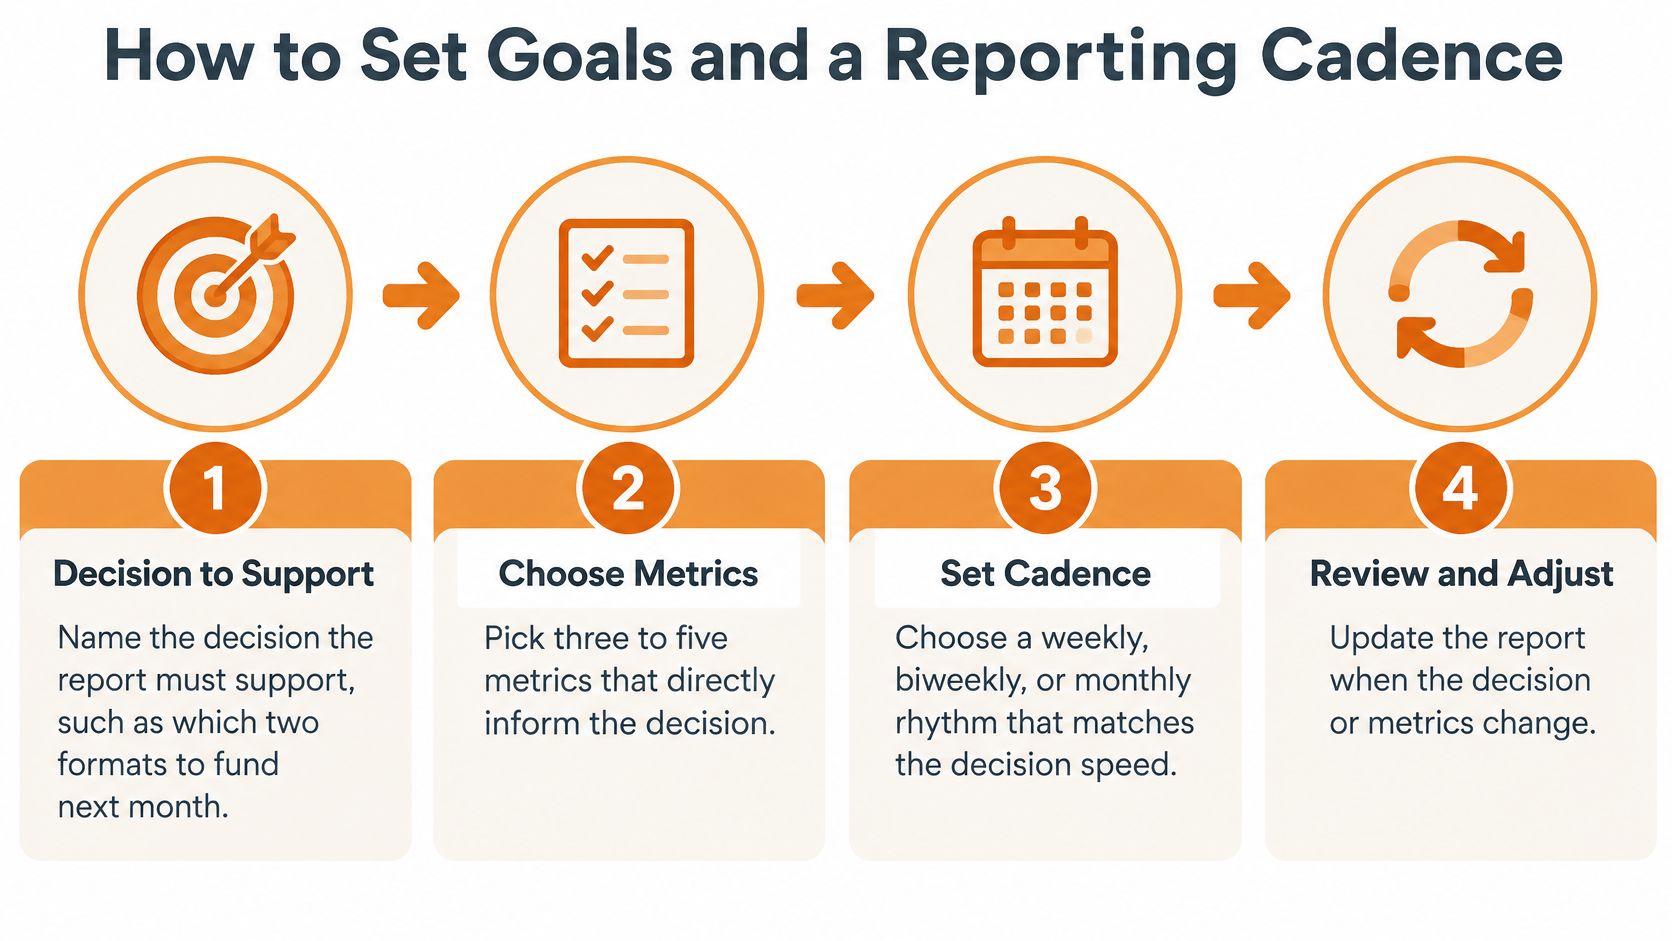
Name the decision first. For example, which two formats get funded next month. A report without a decision becomes a scrapbook of screenshots. The common slip is starting with the metrics you already have and hoping a purpose emerges.
Pick three to five metrics for that decision. Choose from the core metrics, not everything a platform exports. Vanity metrics are tempting because they're easy to find, but ease isn't relevance.
Set a baseline from the last 90 days. Use native platform data and write the formula next to the baseline. Don't compare a holiday peak with an ordinary week, or you'll chase a seasonal effect.
Match cadence to decision speed. Use daily checks for publishing health, weekly reviews for campaign tuning, monthly reviews for channel allocation, and quarterly reviews for strategy. Reporting monthly on something that changes weekly guarantees late fixes.
Assign one owner. One person answers questions about definitions, gaps, and changes. Shared ownership usually means nobody notices when a field stops updating.
Set action thresholds in advance. For example, a drop in reach over two consecutive weeks triggers a format review, while a spike in failed posts triggers a same day fix. Without thresholds, every number turns into an open discussion and nothing gets decided.
Run one full cycle, then audit it. Did each report change a decision? If a panel never changed anything across a whole cycle, remove it.
What a Working Setup Looks Like
Each metric gets one line in a shared document. Formula, owner, baseline, cadence, threshold. That single line prevents most arguments about whose number is right, because the disagreement is usually about definitions, not arithmetic.
Report Templates and Dashboard Layouts
| Cadence | Audience | Core metrics | Decision it supports |
|---|---|---|---|
| Daily | Social media manager | Scheduled, published and failed posts, replies waiting | Fix publishing problems today |
| Weekly | Campaign lead | Reach, engagement rate, click-through rate, top five posts | Adjust next week's posts |
| Monthly | Marketing lead | Follower growth, channel comparison, conversions with confidence labels | Shift budget between channels |
| Quarterly | Executive team | Trends against targets, business outcomes, confidence notes | Change channel strategy |
Build the dashboard top to bottom in that order. Put the daily view first, with publishing status at a glance, scheduled, published, and failed posts, comments waiting for a reply, and the top post by hour. This is the panel that prevents small failures from becoming silent ones.
Below it, the weekly summary fits on one page. Reach, engagement rate, click-through rate, your top five posts, and one recommendation. If the weekly view needs a meeting to explain it, it's carrying too much.
Monthly and Quarterly Views
The monthly view compares channels only on identical definitions, shows follower growth from daily counts, and reports conversions with confidence labels. If your monthly reporting includes creator partnerships, this breakdown of how to measure incremental revenue from creator campaigns shows how to separate creator lift from background growth. The quarterly view drops post level detail entirely. Show trends against targets, three findings, and one budget change.
Follow three layout rules. Give one question per panel, so a reader knows what each chart answers. Never mix definitions on one time axis. Put the source and last sync time in a note under every chart.
Say an agency runs five clients on the same structure. Account managers spot outliers within minutes because every client answers the same questions in the same order. For layout inspiration, browse these social media dashboard examples.
Test your result this way. A reader should find the answer to the report's decision within the first 30 seconds of reading. If they can't, move the answer up and cut what sits above it.
Automating and Centralizing Analytics Across Platforms
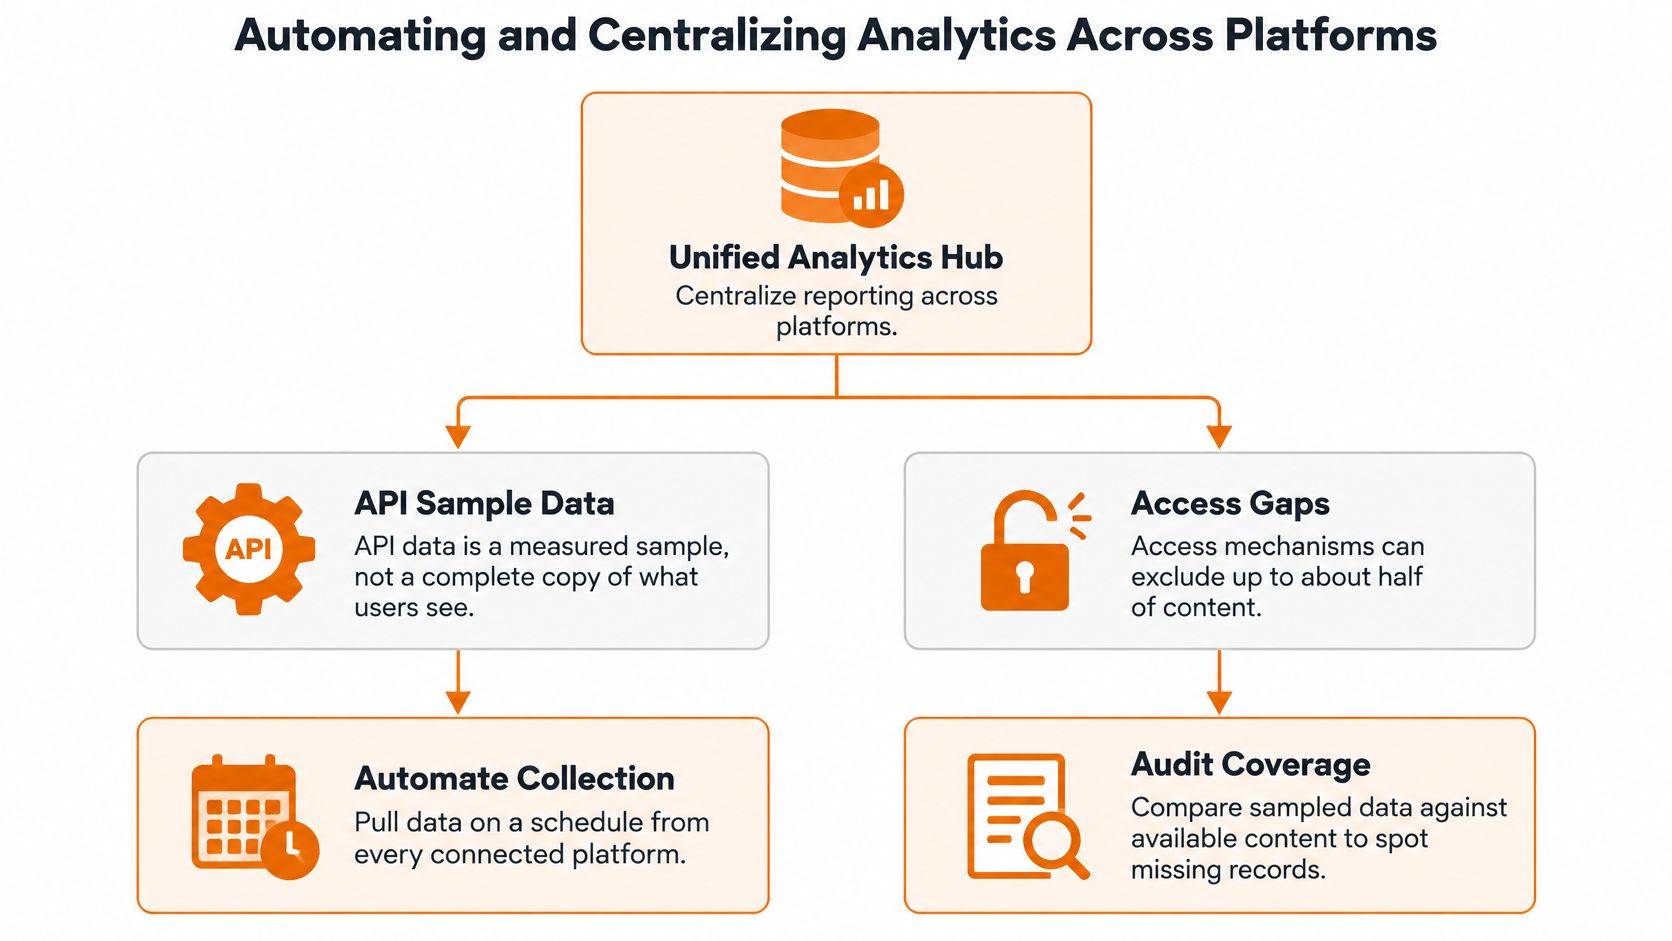
Treat API data as a measured sample, not a complete copy of what users see. A 2026 evaluation of TikTok's Research API and related platform access sits alongside an ACM audit finding that access mechanisms could exclude up to approximately 50% of content, remove up to approximately 83% of contextual metadata, and impose operational limits as low as about 1,000 requests per week. That doesn't make API reporting useless. It makes coverage tracking essential.
Build the Pipeline in Four Stages
- Ingest: Pull through official platform APIs on a schedule. We use the official APIs from each social platform, which keeps you inside platform rules.
- Store raw snapshots: Keep the response exactly as received, so you can recompute later when definitions change.
- Normalize: Map platform fields into your shared schema, keeping raw counters separate from derived rates.
- Publish: Push clean tables to dashboards, with freshness shown on every panel.
Connect the stages with webhooks that fire when a post publishes or a metric refresh completes. Scheduled pulls handle analytics, since most platforms don't push metric updates. Workflow tools such as n8n, Make, or Zapier work well for alerts, like posting a message when a sync fails twice in a row.
Freshness needs to be visible, not assumed. In our setup, new posts are checked for analytics each hour for the first day, then less often as they get older, and supported follower and subscriber counts are saved once each day. A reader who knows that won't mistake a two hour old post for a finished result.
Track Completeness on Every Dataset
Attach four indicators wherever numbers appear. Retrieval success rate shows how many pulls succeeded. Last successful sync shows staleness. Missing field rate shows how much is absent. Native or estimated tells readers whether a value came from the platform or your model.
Make backfills idempotent, so rerunning a job replaces records instead of double counting them. Add anomaly alerts for sudden count changes that look like definition shifts rather than audience behavior.
Alert rule: When a platform stops returning a field, show a gap in the chart, not a zero. A gap invites investigation. A zero invites a wrong decision.
Measure Social Results When Person Level Data Is Missing
Privacy limits aren't just a compliance note. They're a measurement design problem, and reports built for person level tracking break when that data disappears. In HubSpot's 2025 research, 84% of consumers said data privacy is a human right, while marketers cited distrust of personal data use, poor data quality, and privacy regulations as significant audience understanding challenges.
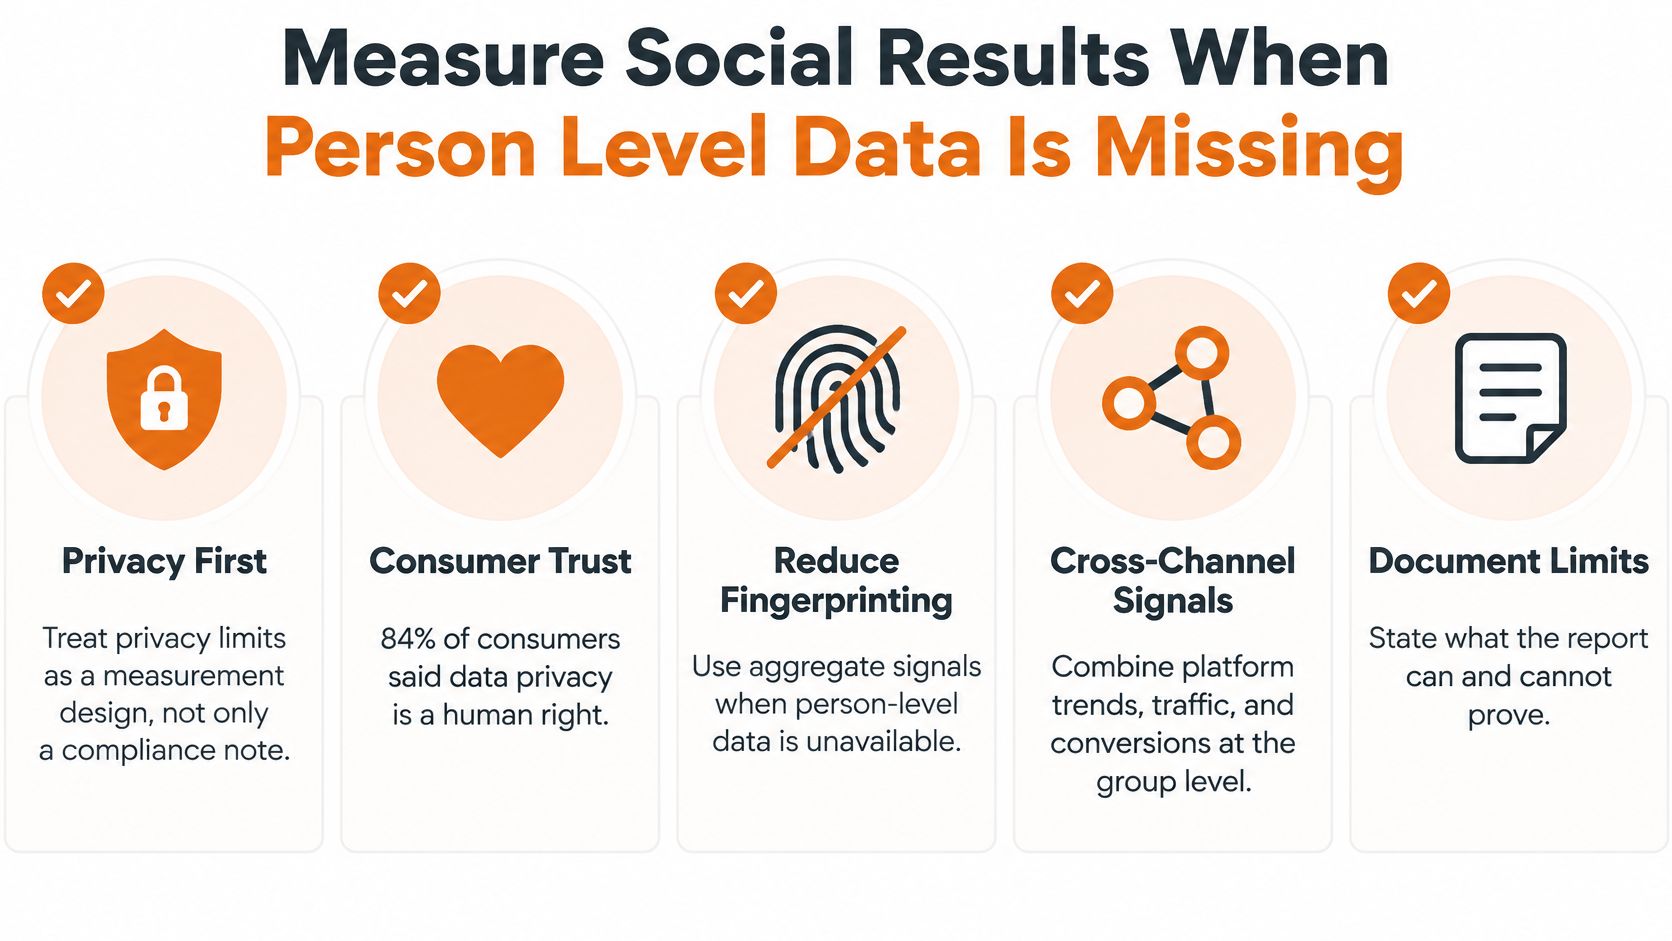
Design the report so it still works when person level joins fail.
- Measure cohorts, not individuals. Group by campaign, format, and channel. Cohort totals survive consent withdrawal and platform restrictions.
- Record missing fields as null, never zero. A withheld identifier isn't inactivity. Coding it as zero drags averages down and invents a decline.
- Limit raw retention. Keep raw snapshots only for the active reporting window, then retain aggregates and the formula used to build them.
- Use totals that don't need stitching. Platform totals, UTM landing page totals, and CRM stage counts each stand on their own without a user graph.
- Print the unmatched share. Next to any joined metric, show what percentage of records failed to match, so dropped data stays visible.
A Monthly Line That Survives These Rules
Branded search rose during the campaign. Profile visits and saves moved with it. The report calls that a leading pattern worth repeating, not revenue caused by a named person, and states plainly what wasn't collected.
That's enough to decide whether to repeat the campaign. Less granular data, consistently defined and auditable, produces more trustworthy reporting than a detailed profile you can't defend. Scheduling and analytics are included in every Mallary plan, so you can plan posts and see their performance without bolting on a separate reporting tool.
Measuring Business Impact When Attribution Is Incomplete
The Sprout Social 2025 Impact of Social Media Report found over half of surveyed marketing leaders identify incompatibility between social tools and the broader marketing stack as the top barrier to understanding social impact. Platforms still print ROI next to clicks and last-touch conversions. Check that claim before you repeat it.

A tidy chart can hide a broken join. Last-touch credit works like a relay race that awards the medal only to the runner who crosses the line. Earlier posts carried the baton, then vanished from the score. When the path is incomplete, a smaller report is the one you can defend: a few outcomes, each marked with how much trust it deserves.
Label Every Claim With a Confidence Level
- High: Native platform counts such as reach and views, taken from one consistent definition.
- Medium: Tracked outcomes such as UTM tagged clicks matched to CRM records.
- Low: Modeled or assisted conversions, and anything inferred across platforms.
High confidence does not mean revenue. A view count can be exact and still say nothing about a sale. A unified API collects consistent publishing and engagement events, but matching field names does not prove a post caused revenue. For the gap between a tracked path and a causal claim, see attribution modeling when credit is incomplete. The video below walks through separating correlation from lift in practice.
To move a claim up a level, run a holdout test. Withhold posts or paid promotion from a matched segment for two weeks and compare it with the exposed group. Lift is the exposed result minus the holdout result over those same two weeks. That difference is lift, not just correlation.
Zero-click outcomes still belong on the page. Saved posts, profile visits, direct messages, and rises in branded search are commercially meaningful. Report them as leading indicators, with the confidence label written beside them, not as revenue.
Say profile visits rise sharply after a campaign. The honest report says the campaign likely contributed, labels that line medium confidence, and sets a holdout for next quarter before anyone books the movement as sales. One revenue sentence you can defend beats a wide dashboard of vanity metrics that do not share a definition.
Mallary's cross-platform analytics show views, likes, comments, engagement, top posts, and channel comparisons for each dashboard profile in one view. Supported follower and subscriber counts are saved once each day, and growth over time shows in the dashboard. Use that view to build the short report, then label each business claim before you treat it as impact. Mallary.ai
Try it with Mallary
STOP!
Want ChatGPT or Claude to post on social media for you?
Connect your social accounts one time. Then tell your AI what to write. It can make your posts, share them, and reply on social sites that allow replies. You do not need to write code.
Pick your AI





Connect once. Ask in plain English. Mallary does the work.


