
September 17, 2026
Social Media Analytics API Complete Developer Reference
STOP!
Want ChatGPT or Claude to post on social media for you?
Connect your social accounts one time. Then tell your AI what to write. It can make your posts, share them, and reply on social sites that allow replies. You do not need to write code.
Pick your AI





Connect once. Ask in plain English. Mallary does the work.
You've been asked to build one dashboard for Instagram, YouTube, LinkedIn, TikTok, and Pinterest. The first version looks simple: authenticate each account, call the analytics endpoints, place the results into common columns, and refresh the page when a customer opens it. Then the discrepancies arrive. One platform calls a number “views,” another calls it “reach,” a third no longer returns the field you mapped last quarter, and a fourth only exposes account-level reporting.
A production-grade social media analytics API is therefore less about collecting JSON than preserving meaning. Your pipeline needs to know which metrics exist, what each metric measures, how fresh the value is, which permission makes it accessible, and whether a missing field means “zero” or “not reported.” The reference below treats those decisions as engineering concerns, not dashboard polish.
Table of Contents
- Introduction to Social Media Analytics APIs
- Core Metric Categories and What They Measure
- Official Platform Analytics APIs at a Glance
- Authentication Permissions and Access Requirements
- Endpoint Reference and Sample Payloads by Platform
- Rate Limits Quotas and Reliable Polling Design
- Data Normalization Mapping and Handling Deprecated Metrics
- Integration Patterns Webhooks and Unified API Options
Introduction to Social Media Analytics APIs
A social media analytics API is an interface that retrieves performance data programmatically from a social platform. It may expose account-level values such as follower counts and audience activity, post-level values such as likes and shares, or time-based reports that show how those measurements change. A unified API adds another layer, presenting multiple platforms through a common access pattern and, ideally, a documented normalization model.
That last qualification matters. Publishing APIs and analytics APIs solve different problems. A publishing request usually asks a platform to create or schedule an object. An analytics request asks the platform to describe what happened to that object, often using platform-specific definitions, retention rules, permissions, and reporting delays. A successful publish call proves that content exists. It doesn't prove that comparable performance data will be available later.
The dashboard problem
A team building a cross-network dashboard commonly starts with a shared table containing fields such as impressions, views, likes, comments, shares, and followers. That table is useful only when every cell carries its platform context. Instagram's content views aren't automatically equivalent to YouTube views, and a platform may expose no impression metric at all.
The practical design is to separate three layers:
- Raw platform data: Store the response as received, including fields your normalized model doesn't currently use.
- Canonical metrics: Keep a deliberately limited set of fields that can be compared with confidence.
- Coverage metadata: Record whether a field is native, derived, deprecated, unavailable, or restricted to a particular content type.
This reference follows that order in practical terms. It starts with metric vocabulary, then compares platform coverage and freshness, explains access requirements, maps representative endpoints, and turns quota rules into polling architecture. The most important implementation guidance appears in the normalization section, where metric loss and deprecation become versioned schema events rather than silent breaking changes.
Practical rule: A unified response shape is useful only when it also tells consumers where comparison is valid.
The growing demand for this infrastructure is reflected in the social media analytics market forecast, which projects expansion from USD 9.32 billion in 2025 to USD 10.94 billion in 2026, then USD 24.42 billion by 2031, implying a 17.42% CAGR over 2026–2031. That growth makes analytics infrastructure more valuable, but it also raises the standard for honest coverage reporting.
Core Metric Categories and What They Measure
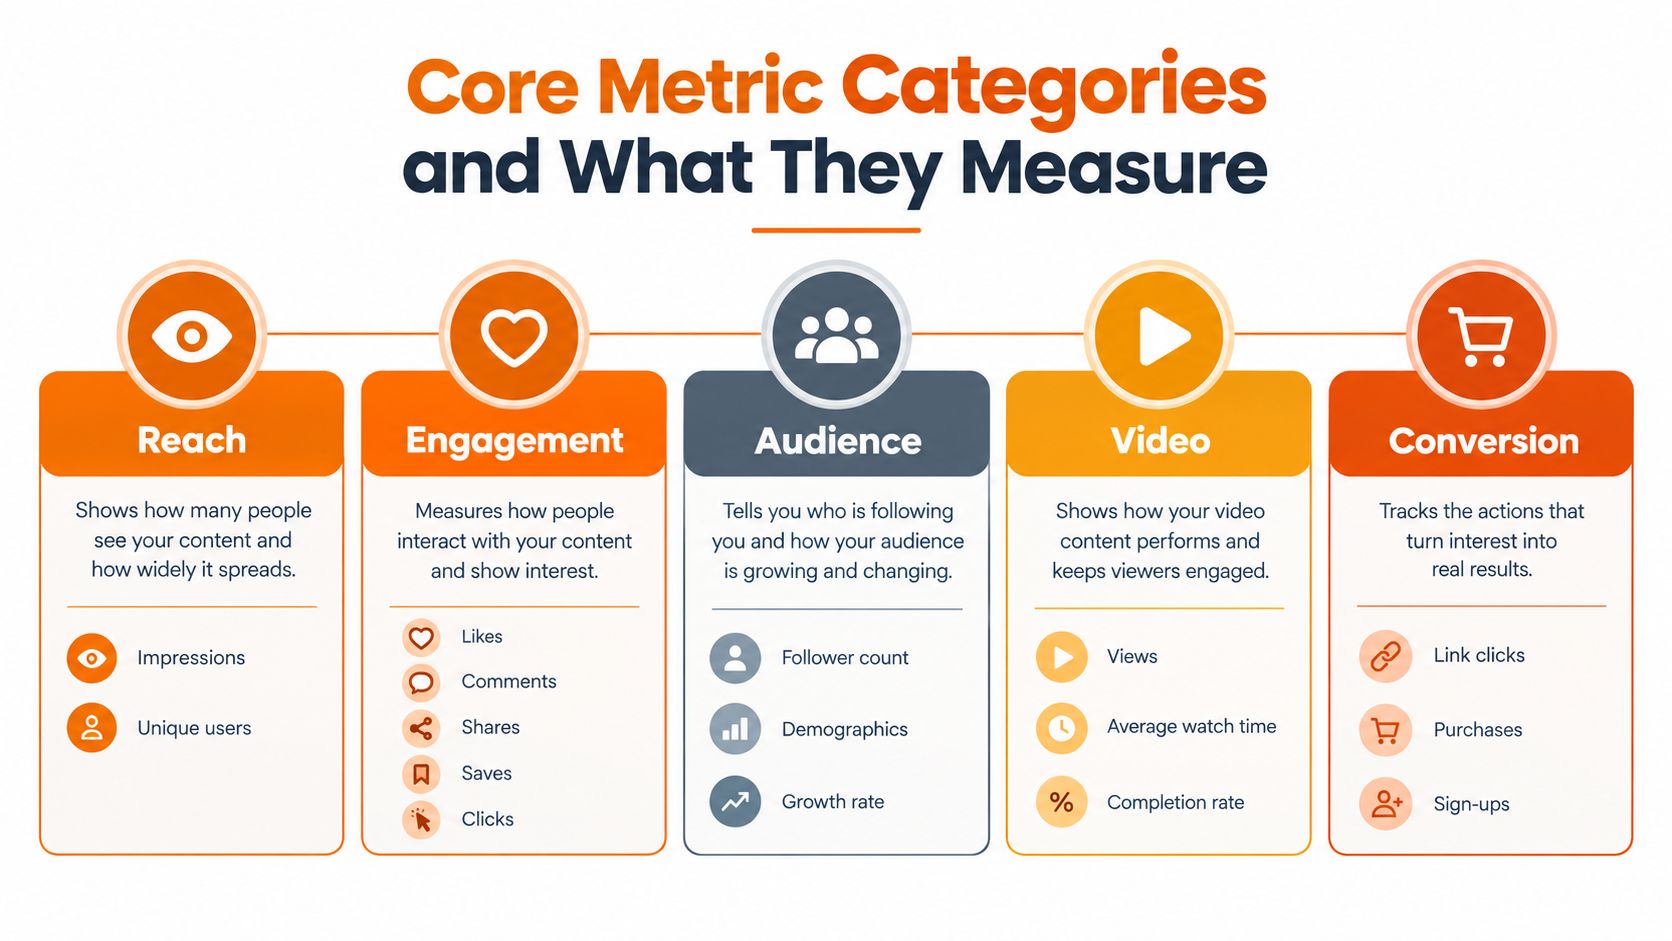
Before mapping endpoints, define the business question behind each metric family. A social media analytics API should not treat every returned integer as interchangeable. The same label can describe different events, time bases, or audiences depending on the platform and content type.
Reach answers who encountered content
Reach usually addresses exposure by counting unique users or accounts reached. Impressions generally describe the number of times content was displayed, so repeated exposure can contribute more than once. Those definitions are not universal, and some platforms don't provide one or both fields.
Use reach when a stakeholder asks, “How many distinct people did we reach?” Use impressions when the question is closer to, “How much total distribution did this content receive?” Don't calculate one from the other unless the platform documents that relationship or your own model explicitly labels the result as derived.
Engagement explains visible response
Likes, comments, shares, saves, and clicks describe actions, but they aren't equally meaningful. A save can indicate future intent, a share can extend distribution, and a comment can create a conversation. A dashboard that adds all actions into one engagement total may be convenient, but it hides the difference between passive reaction and active propagation.
For normalization, retain the component fields whenever possible. You can calculate a product-specific engagement rate later, but you can't reconstruct saves or shares after discarding the raw response.
Audience metrics describe the account
Follower count, following count, demographics, and growth relate to the account rather than a single post. Audience values also require a time dimension. A current follower count is a snapshot, while follower growth requires multiple snapshots and a clear interval.
Don't put account totals beside post totals without making the grain explicit. A post row can contain engagement for that post, while an account row can represent a platform's cumulative or windowed reporting period.
Video metrics need their own interpretation
Views, average watch time, completion rate, and retention describe video consumption. A view may be triggered by a platform-specific playback rule, so comparing views across networks without a definition column creates false precision. Completion rate is particularly sensitive to video length and the platform's counting threshold.
Store the native video fields and preserve the content type that produced them. A short-form video view and a long-form video view can both be valid native measurements without being equivalent cross-platform outcomes.
Conversion metrics connect content to action
Link clicks, purchases, sign-ups, and other downstream events require attribution rules outside many native social endpoints. Your analytics layer should identify the source of the conversion and the attribution window rather than presenting a conversion count as if the platform alone generated it.
A useful canonical model contains the metric value, source platform, content type, reporting window, collection timestamp, and comparability status. For a broader treatment of how teams select and interpret content KPIs, the content performance metrics guide provides useful context. The market's projected growth reinforces why this vocabulary matters, but it doesn't make inconsistent platform definitions disappear.
Official Platform Analytics APIs at a Glance
Official APIs differ in more than endpoint syntax. They vary in whether post-level analytics exist, how far back data can be requested, how quickly metrics settle, and whether access is restricted to business, creator, page, or channel accounts.
The matrix below is a planning tool, not a promise of universal coverage. Treat each cell as something to verify against current platform documentation and the account type you intend to support.
Platform Analytics Coverage and Freshness Matrix
| Platform | Post-Level Analytics | Refresh Latency | Historical Depth |
|---|---|---|---|
| YouTube | Available through YouTube Analytics surfaces | Depends on report availability and processing | Report and channel rules apply |
| Available through Meta Insights surfaces | Platform-dependent and quota-sensitive | Endpoint and metric rules apply | |
| Available for supported professional content | Platform-dependent and content-type-sensitive | Endpoint and metric rules apply | |
| TikTok | Available for supported analytics surfaces | Platform-dependent | Account and content rules apply |
| Available for supported company and content surfaces | Platform-dependent | Account type and endpoint rules apply | |
| X | No general analytics surface | Not applicable | Not applicable |
| Available through Pinterest Analytics | Platform-dependent | Endpoint and account rules apply | |
| Threads | Coverage exists for selected insights | Platform-dependent | Historical availability varies |
| Native post signals exist, but broad account analytics are limited | Platform-dependent | Author and endpoint rules apply | |
| Snapchat | Available for supported accounts and content | Platform-dependent | Surface and account rules apply |
Recent independent coverage highlights the operational gaps buyers often discover too late. Some APIs may refresh analytics on a 24-hour interval, restrict post refreshes to content published within seven days, and limit forced refreshes to a small daily allowance for a team. The same coverage notes that X, Discord, and Slack don't provide analytics, while Google Business Profile is account-level only. These constraints are described in the multi-platform analytics coverage guide.
Read the matrix as a buying filter
Start with the channels your customers use. If a required network has no post-level surface, no normalization strategy can manufacture the missing data. Mark that platform as unavailable, expose the native signals you do have, and keep it out of cross-platform totals.
Next, define acceptable freshness. A daily reporting dashboard can work with scheduled snapshots. A moderation or campaign-monitoring workflow may require event notifications, but even webhooks don't guarantee that every derived metric is available immediately.
Finally, check historical depth before promising trend reports. Platforms commonly expose different windows for different metrics, and some fields may be removed while the underlying content remains visible. A dashboard should display the reporting timestamp and coverage state beside important values.
Authentication Permissions and Access Requirements
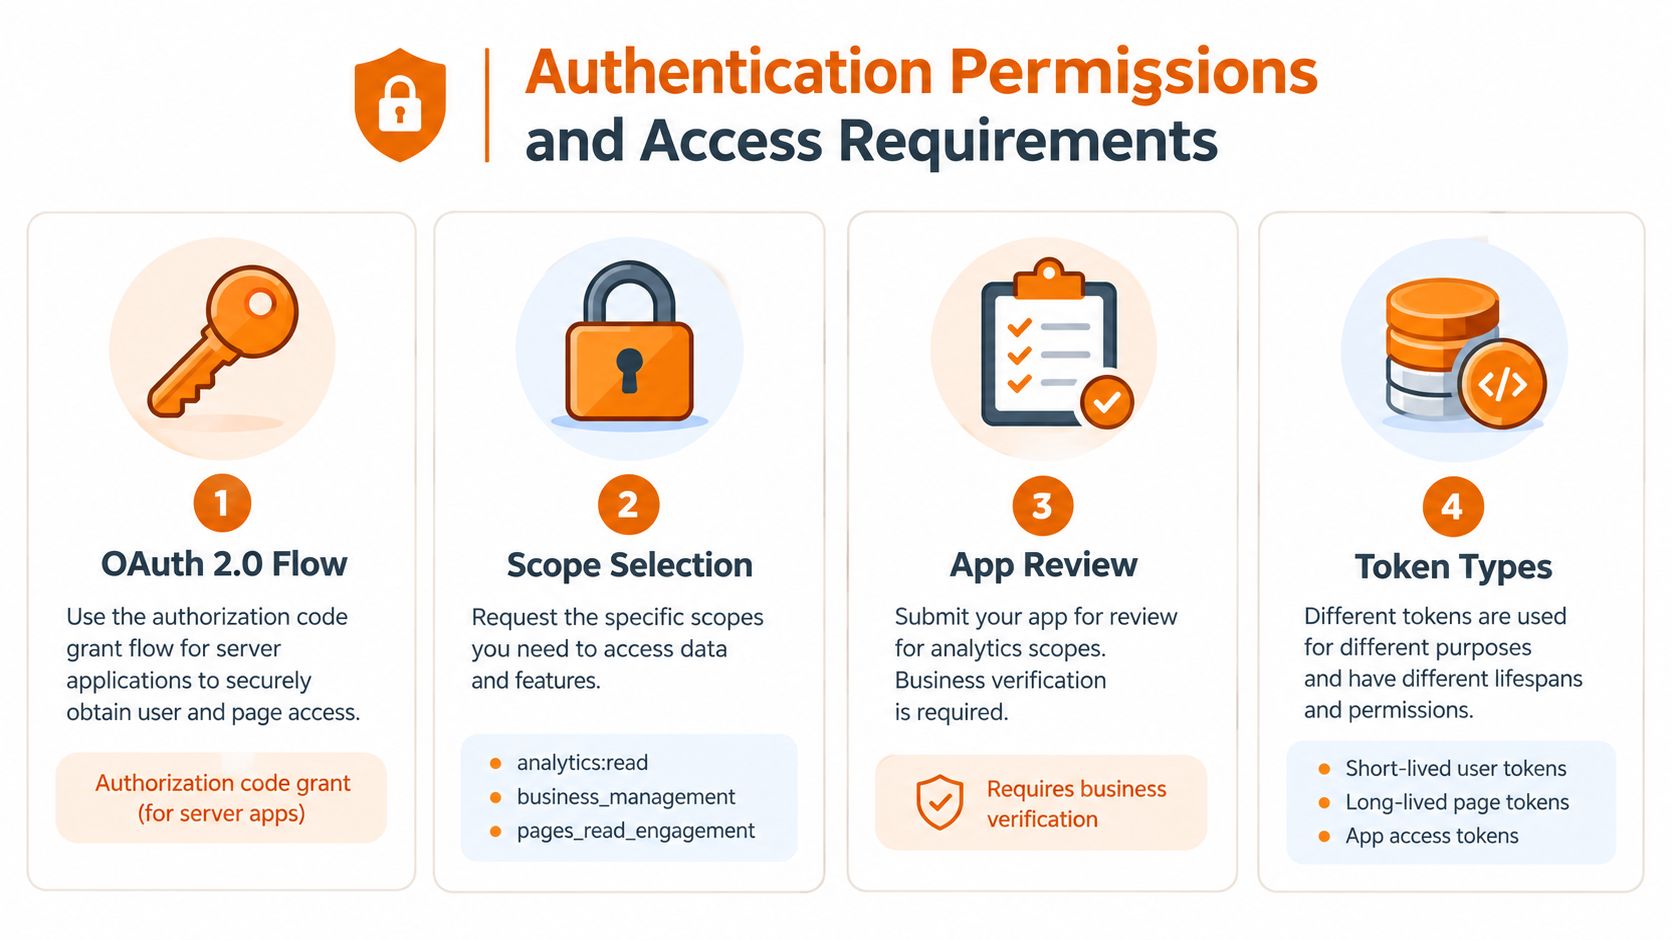
Access failure often looks like an endpoint problem, but the root cause is usually account type, missing scope, app review, or an expired token. Build authentication as a capability check, not as a single login screen.
Start with the account and data boundary
Identify whether the integration reads a page, professional account, creator account, channel, company page, or personal profile. The same platform can expose different analytics permissions and fields for each account class. Don't request broad access before you know which resources the product needs to read.
A practical permission checklist looks like this:
- Define the resource owner. Store the platform account identifier and the organization that authorized it.
- Request least-privilege scopes. Separate publishing scopes from analytics and engagement scopes where the platform allows it.
- Complete review requirements. Business verification or app review may apply to analytics-related permissions, particularly for Meta surfaces.
- Persist token metadata. Track expiry, granted scopes, refresh status, and the last successful API call.
- Handle revocation explicitly. A revoked token should disable the affected connection without blocking other customer accounts.
OAuth is only the beginning
Most production integrations use an OAuth authorization-code flow for server-side applications. The callback should validate state, exchange the code securely, and immediately associate the resulting token with the correct tenant and social account. Never use a browser-delivered access token as your long-term credential store.
Token storage deserves the same care as any other credential system. Encrypt secrets at rest, restrict decryption to the worker that needs them, avoid placing tokens in logs, and make disconnect operations remove or invalidate stored credentials. A unified provider can manage much of this flow, but your application still needs clear consent records and account ownership boundaries.
Access check: Test permissions with the smallest supported request before building a full historical importer. A successful OAuth callback doesn't guarantee access to every analytics endpoint.
Use separate connection states for authorized, pending review, expired, revoked, and unsupported account type. This prevents a generic “analytics unavailable” message from hiding an actionable fix. It also lets scheduled workers skip known failures instead of retrying them indefinitely.
Endpoint Reference and Sample Payloads by Platform
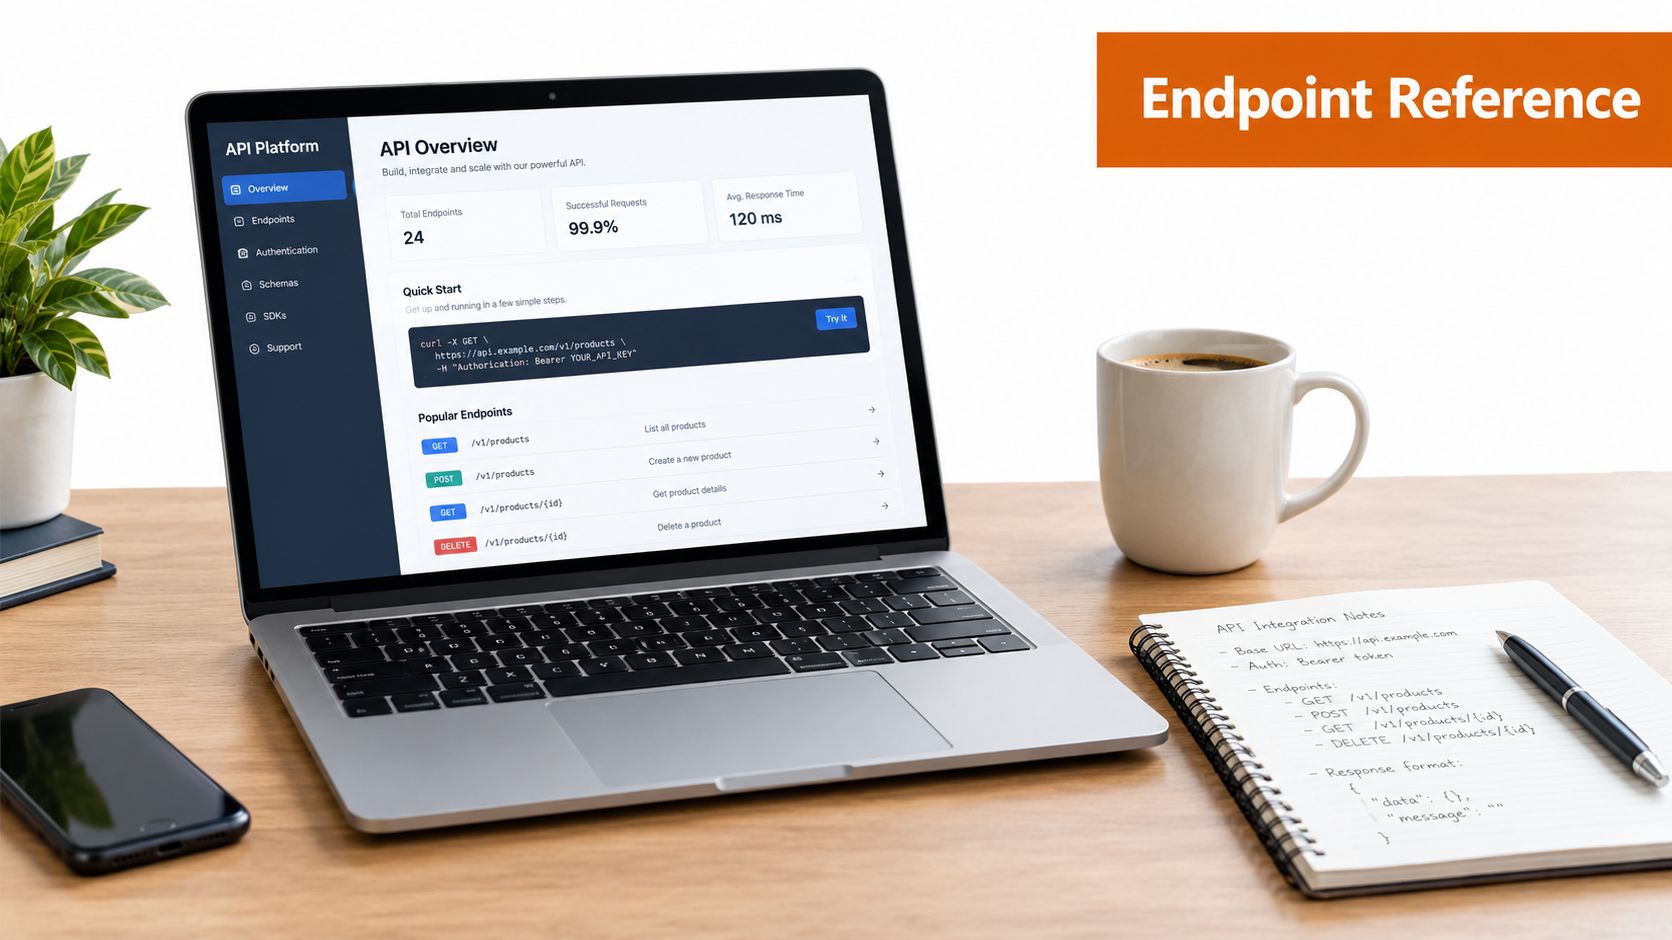
Endpoint names and permissions change, so keep your adapter layer isolated from the rest of the reporting system. The examples below use representative request shapes and response fields. Treat them as mapping references, then confirm the current official documentation for the exact version, scope, and account type.
Meta Graph Insights
Meta's Graph API and Insights surfaces cover Facebook and supported Instagram professional accounts. A typical adapter requests an object identifier and a platform-approved metric list:
GET /{object-id}/insights?metric={metric-name}
A normalized response might retain fields in this shape:
{"name":"reach","period":"day","values":[{"value":123}],"title":"Reach"}
The exact fields depend on the object and media type. Instagram feed analytics may expose views, reach, likes, comments, saves, shares, reposts, profile visits, follows, and total interactions, while impressions are deprecated according to recent platform-focused coverage. Meta also removed unique-impression and three-second video-view fields across Graph API versions in mid-2026, including several post-level and page-level impression fields. The social analytics API field-change guide documents those coverage concerns.
The adapter should therefore keep a metric registry keyed by platform, API version, object type, and media type. Don't send one universal metric list to every Meta object. Unsupported metrics can fail the request or disappear from the response, creating misleading zeros.
YouTube Analytics
YouTube separates channel and video resource data from reporting through the YouTube Analytics API. A report request generally identifies a channel, dimensions, metrics, and a date range:
GET /v2/reports?dimensions=video&metrics=views,likes,comments&filters=channel==CHANNEL_ID
A response can be represented as:
{"columnHeaders":[{"name":"video"},{"name":"views"}],"rows":[["VIDEO_ID",1234]]}
Keep the reporting date range and channel identifier beside the returned rows. YouTube's Data API may provide current video statistics, while detailed time-window reporting belongs to the Analytics API. Mixing those sources without labeling their time bases is a common source of unexplained discrepancies.
TikTok and LinkedIn
TikTok analytics availability depends on the authorized product and account. Map native video views and engagement fields only when the selected surface exposes them, and record unsupported metrics as unavailable rather than inferring reach.
LinkedIn separates personal and company analytics capabilities. A company page adapter may request page or post statistics, while a personal profile can expose a different set of fields. Use separate schemas or capability profiles for those account types. A response such as {"totalShareStatistics":{"likeCount":12,"commentCount":3}} should retain its origin and object type before mapping to common fields.
Pinterest and the remaining networks
Pinterest Analytics commonly works at the pin and account reporting layers. A representative request might look like:
GET /user_account/analytics?start_date=YYYY-MM-DD&end_date=YYYY-MM-DD
A response can contain metric maps such as:
{"all":{"IMPRESSION":123,"PIN_CLICK":7,"SAVE":9}}
Reddit's post objects provide engagement counters, but those counters shouldn't be labeled impressions. Threads and Snapchat require capability checks for the selected account and content surface. X has no general analytics surface in this reference, so your unified response should return an explicit unsupported state.
A strong adapter contract should return four things: normalized values, raw payload, coverage metadata, and collection timestamp. That contract makes later deprecations survivable because the reporting layer doesn't need to know how each platform was queried.
Rate Limits Quotas and Reliable Polling Design
Analytics workloads fail when developers treat dashboard reads as live API queries. A customer opening a report can trigger repeated calls across accounts, date ranges, and metric groups. The safer pattern is scheduled ingestion into your own store, followed by dashboard reads from snapshots.
Meta documents Graph API limits at the app and user level. Its formula limits calls within one hour to 200 multiplied by the number of users, as described in the Meta Graph API rate limiting documentation. Shared app tokens can therefore become a bottleneck when many analytics workers poll independently.
Google Analytics provides a useful architecture benchmark, even though it isn't a social network. Standard properties have 200,000 core tokens per day, 40,000 per hour, 14,000 core project-per-property-per-hour, and 10 concurrent core requests per property, according to the Google Analytics Data API quota reference. Those limits favor batch jobs, bounded concurrency, and cached report reads.
Build the snapshot pipeline
Use a scheduler to identify due accounts and posts. Put work into a durable queue, group compatible requests, and write an idempotent snapshot keyed by platform object, reporting window, metric version, and collection time.
A worker should:
- Batch compatible reads: Request multiple metrics or objects where the official endpoint supports it.
- Cache stable results: Serve dashboards from your database or cache instead of repeating upstream calls.
- Back off deliberately: Respect retry-after signals and use bounded exponential backoff for transient failures.
- Separate tenants: Track quota consumption per app, user, account, and platform as applicable.
- Expose freshness: Show the last successful collection time beside every report.
The embedded walkthrough can help teams visualize the general polling and caching pattern. Use it as implementation context, not as a substitute for each platform's current quota documentation.
A dashboard request should ask your system for a snapshot. It may offer a controlled refresh action, but that action must pass through the same quota-aware queue. More implementation context on designing resilient request budgets is available in this API rate limits engineering guide.
Data Normalization Mapping and Handling Deprecated Metrics
Normalization should be versioned because platform semantics aren't stable. A field can be renamed, deprecated, restricted to one media type, or removed from an API version while the underlying post still exists. If your canonical schema fills the gap, users will interpret an absence as a measured zero.
Preserve evidence before simplifying
Store the raw response separately from the normalized record. The normalized record should include the source platform, native field name, metric definition, content type, API version, reporting period, and collection timestamp. Add a coverage state such as native, derived, unavailable, deprecated, or restricted.
A compact model might look conceptually like this:
| Canonical field | Native mapping | Status | Consumer guidance |
|---|---|---|---|
reach |
Platform-specific unique exposure field | Native or unavailable | Compare only where definitions align |
impressions |
Platform display count | Versioned | Never substitute views silently |
views |
Platform playback or content-view field | Native or derived | Preserve the native definition |
engagement |
Component actions | Derived | Keep likes, comments, shares, and saves separately |
followers |
Account audience count | Native | Store as a timestamped snapshot |
Use null or an explicit availability object when the product needs to distinguish “not reported” from “zero.” If your storage model uses integers only, expose coverage metadata so consumers don't chart unavailable values as performance failures.
Treat metric loss as a migration
When a platform deprecates impressions, don't delete the column overnight. Introduce a new metric version, such as instagram.views.v2, mark the previous mapping as deprecated, and preserve historical rows under their original definition. The user interface should display the metric name and definition that applied when the value was collected.
Fallbacks can be useful, but they must be visible. Mapping a platform's content views into an internal exposure field may support continuity, but it isn't the same as preserving impressions. Label the value as derived and prevent it from entering a cross-platform total unless the comparison policy allows it.
Schema principle: A missing metric is information about platform coverage. It isn't evidence that nobody engaged.
Snapshot design also matters. Quotas and concurrency limits make it impractical to rebuild history on demand, so write each successful refresh as a time-series observation. Keep the raw payload and mapping version with that observation. When a definition changes, reports can show a clean break instead of blending incompatible values into one trend line.
Integration Patterns Webhooks and Unified API Options
Pull-based ingestion remains the dependable default for analytics because many platforms don't emit every metric change as a webhook. Schedule collection according to the freshness your report requires, then use webhooks for events that benefit from immediate notification, such as post publication, connection changes, or incoming engagement objects.
A durable integration usually has four components:
- Preflight validation: Confirm account type, permissions, supported metrics, and content eligibility before scheduling work.
- Queue-backed workers: Keep platform calls outside the web request and retry transient failures without duplicating snapshots.
- Late-arriving metric handling: Allow a later snapshot to replace a provisional value while retaining the earlier observation.
- Coverage-aware reporting: Show unavailable fields and stale timestamps instead of presenting a complete-looking chart.
Build directly when you support a small set of platforms, control the connected accounts, and need native semantics. Consider a unified provider when OAuth, token refresh, quota accounting, endpoint changes, and normalization would otherwise become a permanent product subsystem. The market estimates cited by Global Market Insights project the social media analytics market from USD 10.2298 billion in 2024 to USD 43.2467 billion by 2030, with a 27.2% CAGR from 2025 to 2030. That projected expansion makes the infrastructure layer attractive, but it doesn't remove the need to inspect actual platform coverage.
Teams evaluating an integration architecture can also use this data integration guide from HelpWithMetrics for broader guidance on source systems, transformations, and dependable delivery. For event-driven designs, this explanation of what a webhook is and how it works is a useful companion to scheduled analytics pulls.
Mallary.ai is one option for teams that want a managed layer around multi-platform publishing, engagement, and analytics. Its public API provides analytics snapshots through GET /api/v1/analytics, along with current audience counts, so product teams can retrieve report data without maintaining every native connection themselves. Evaluate it against your required platforms, metric coverage, freshness policy, raw-payload needs, and quota behavior before committing.
Mallary.ai can provide a unified API and dashboard for publishing, engagement, and analytics across supported social platforms, with managed OAuth, token refresh, retries, idempotency, queues, webhooks, and platform-specific validation. If your team is building a cross-network reporting or automation product, visit Mallary.ai to review the available integration approach and decide whether it fits your coverage and normalization requirements.


